Storage Reports
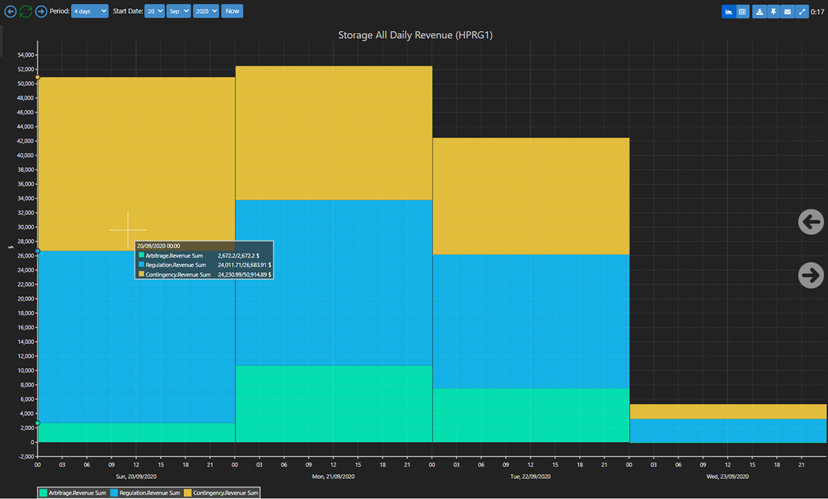
Storage units in the NEM are represented as 2 separate DUIDs, a load DUID and a generator DUID. We have added new reports focused on analysing storage data. These reports can be found in the All Reports page navigating to the Renewables section (from the dropdown). A storage unit’s primary source of revenue is from the FCAS markets and this is evident from the revenue reports.
MT Pasa Reports
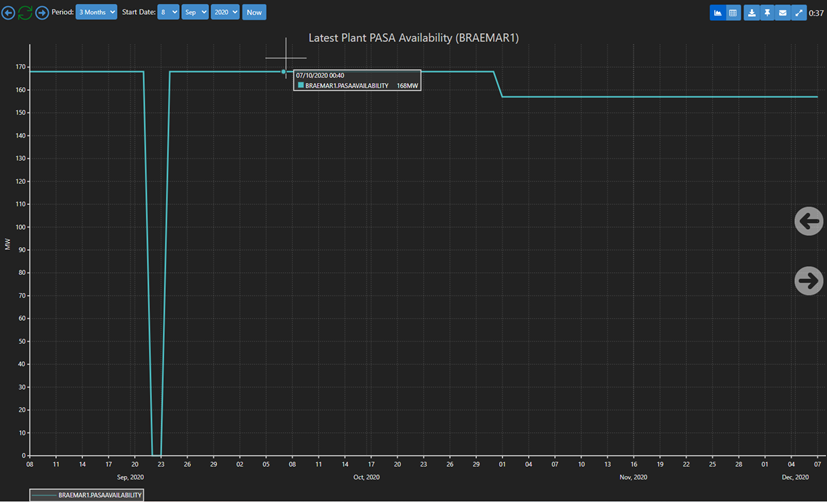
AEMO has released an interim solution for one of the changes for National Electricity Amendment (Improving Transparency and Extending Duration of MT PASA) made on 20 February 2020. This change being to publish generation availability of individual scheduled generating units. IES has captured this new dataset and created reports that show them in all of IES NEO service (NEOmobile, NEOpoint and NEOexpress). These reports can be accessed in the All Reports page and under the PASA section from the dropdown.
Constraints
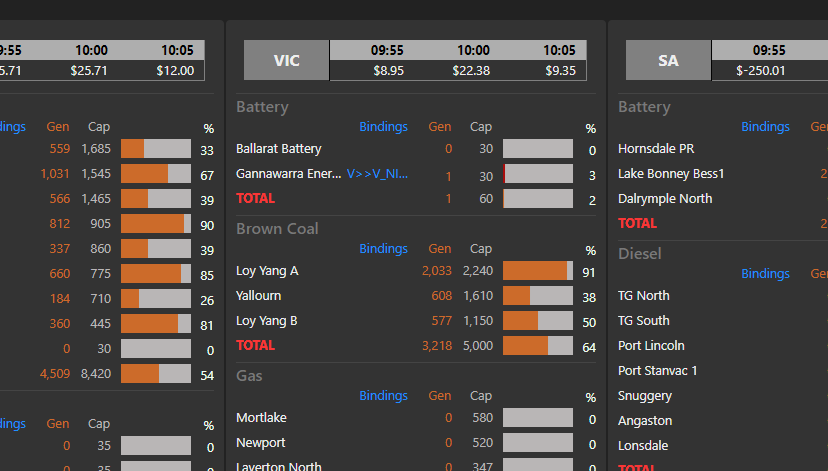
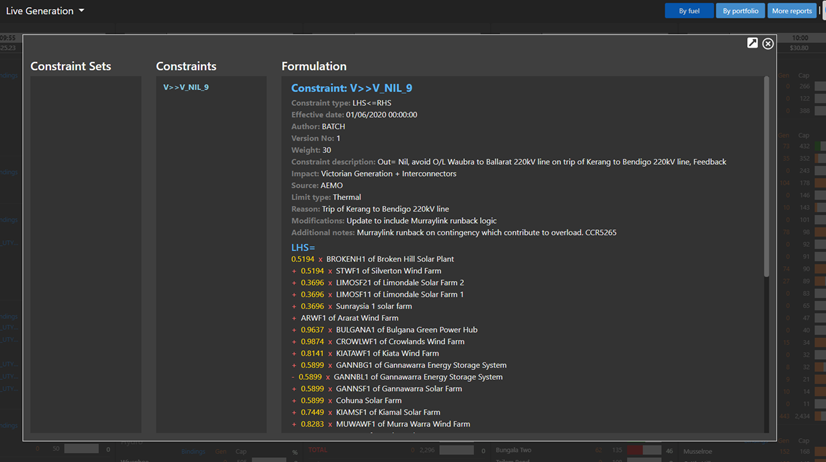
As the power system continues to change and adapt, more participants are facing the burden of being constrained as a result of network constraints. We have added new features and reports to NEOmobile to help you monitor and understand the impact of constraints on dispatch outcomes. We’ve added a third column to the live generation view which will display any binding constraints that have made an impact on the station. This column will also provide a link to the constraint view allowing customers to quickly understand the constraint.
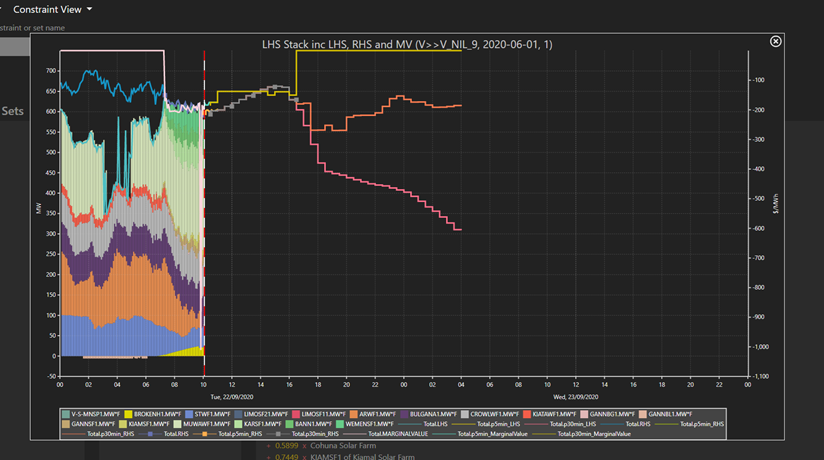
A new visual aid has been added to the constraint view to display all the dispatch and predispatch components of the LHS of the constraint. This view can be opened by clicking the “Equation Chart” button on the constraint view. This chart can be used to understand the primary influencers of the constraint and to understand the level of headroom or capacity in a constraint over a period of time.
Constraint View
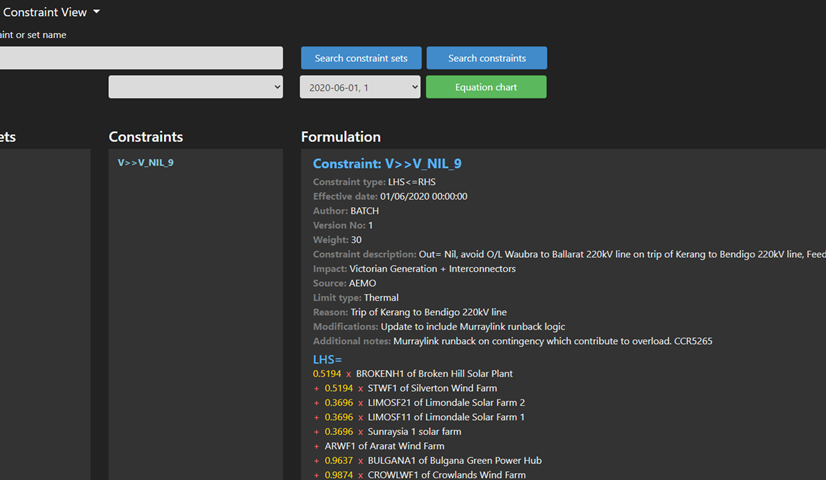
The Constraint view has been redesigned with a slightly easier to understand colour scheme. Also the RHS sub sections and Equation sub sections are now collapsible.
Local Pricing
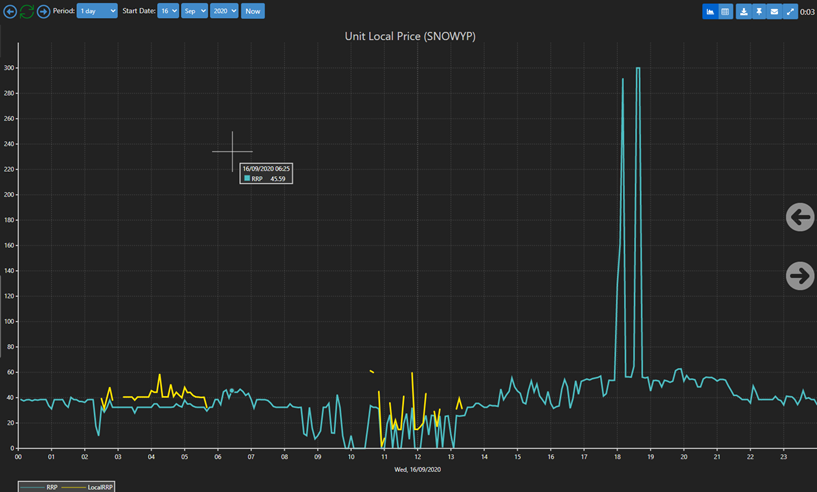
Due to the presence of network constraints, units that are behind congested transmission lines might see their output curtailed or increased at less than favourable regional prices (being constrained OFF or constrained ON). In these scenarios, the unit is said to be dispatched at a different price (the local price). We have added new reports to visualise the local price that is having an impact on the unit. These reports can be found in the All Reports under the Constraints Section.
The best way to understand this is to go through an example. Consider the Constrained-ON report for Sep 1, 2020 in NSW1 (figure above), the report shows that SNOWP and GUTHEGA units were constrained ON. This implies that NEMDE dispatched these units even though their bid prices (accounting for loss factor) were higher than the current region price. If we open the local price report for SNOWPY we see that the local price is higher than the current RRP, because a unit’s local price is the price at which the unit was dispatched at. Local price is what the RRP should’ve been for the unit to be dispatched had there been no network constraint.
