NEOmobile provides instant access to a complete set of real-time NEM & Gas market reports on any device with a web browser.
ANALYSIS
NEOmobile has 800+ reports. NEOmobile handles the unique processing requirements of Australian NEM data like bids and constraints to extract the most information and present it in an informative way. Reports are grouped and linked to make it easier to access related data.
Here are just some of the analysis features built in to NEOmobile.
- Ability to handle data of different periodicity and detect missing data
- Ability to combine many different chart styles in a single chart
- Ability to chart data at different times on the same time axis
- Lines can be plotted with shading representing other data elements. This is utilised in showing interconnector limits binding constraints.
- Handles bid and rebids for electricity and gas
- Advanced time classification that understands that public holidays differ by region
- Advanced chart and table styling that uses dynamic meta-data. A simple example is changing the colour, line styles, thickness etc of chart lines based on data.
- Specific chart styles that don't even exist in any other charting package, e.g. Merit Order Bidstack.
DETAILS
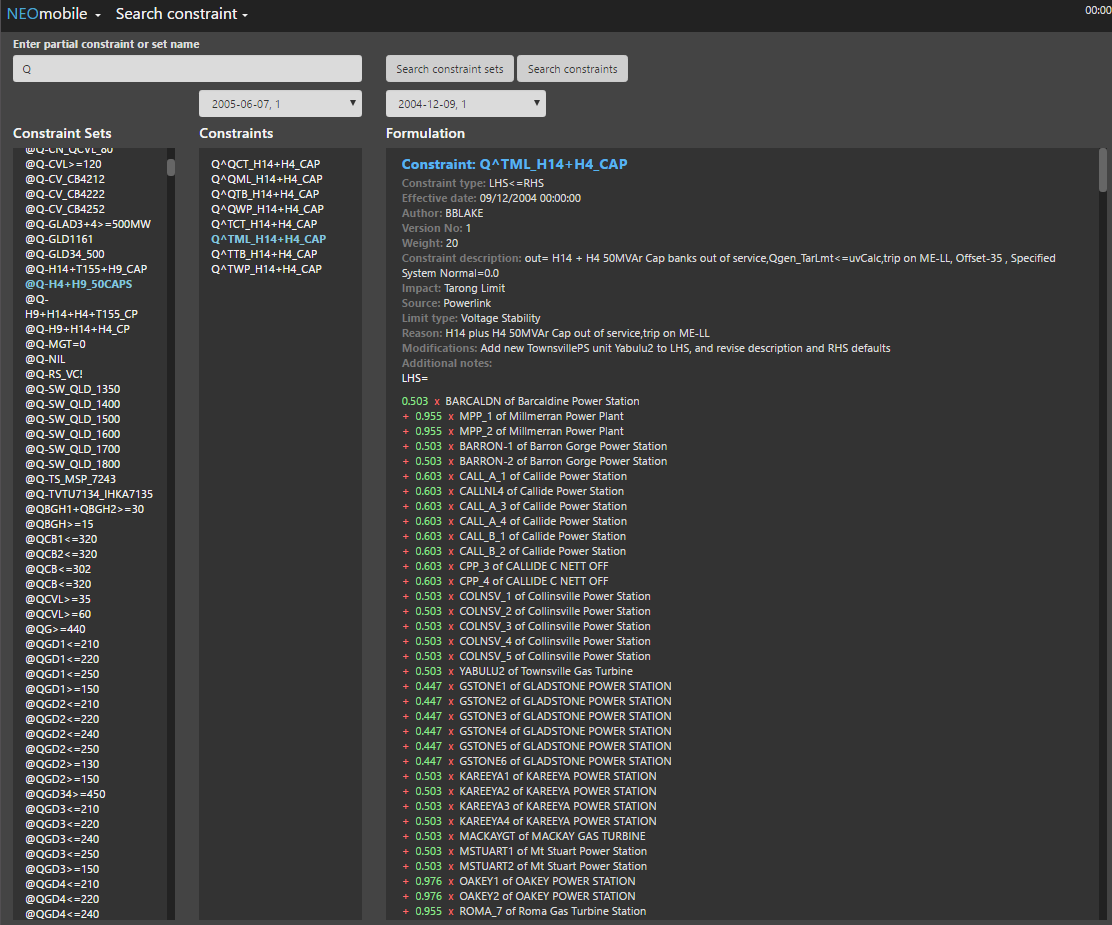
NEOmobile provides in-depth analysis of data. Tabs on the Overview page include NOS outages and Binding constraints. These have links to the constraints search page so that a given constraint or constraint set can be investigated further.
The constraints search page has the following features.
- Search by constraint set or constraint
- Click on a constraint set to see all the constraints in that set for a given date/version
- Click on a constraint to see the constraint formulation for a given date/version
- The plain language constraint formulation has syntax colouring and is formatted to make it easy to read.
DRILL DOWN + HISTORY
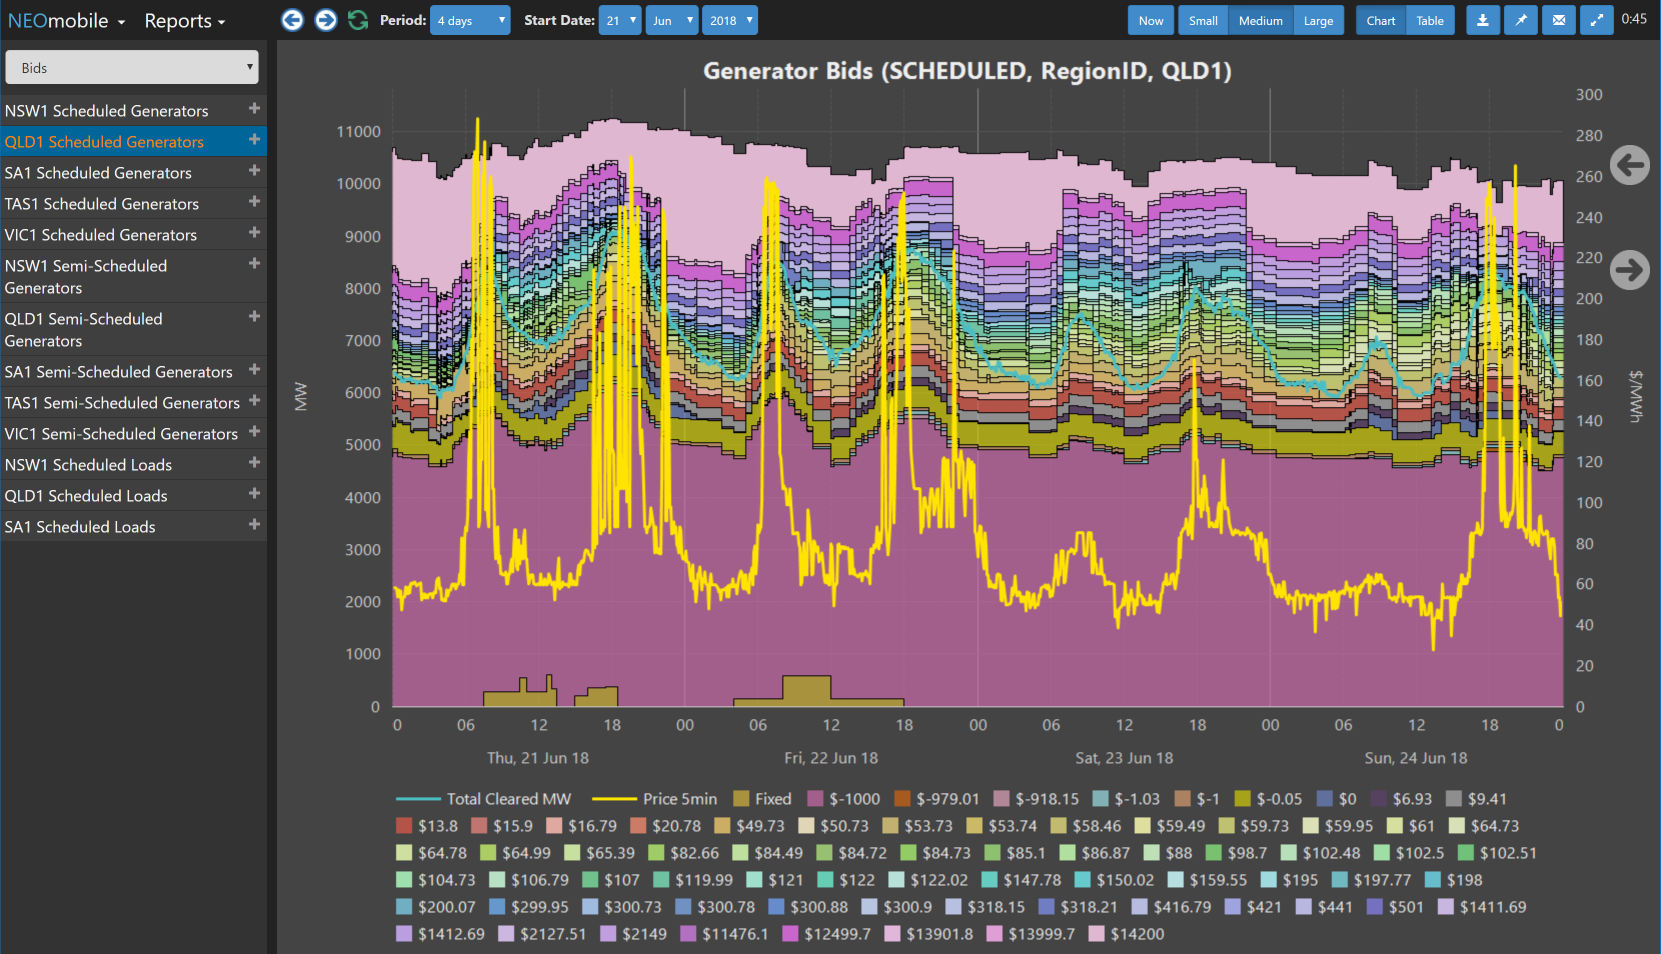
The "All Reports" tab in NEOmobile has 800+ reports organised in hierarchical fashion from region, portfolio in region, stations and down to plants so its easy to drill down to get the full picture. NEOmobile has always been about showing the current state of the market but "All reports" now allows the user to set a start date and period for any of the reports.
Here are just some of the analysis features built in to NEOmobile.
- Reports are organised into 17+ categories like Price, Demand, Generation, Bids etc.
- Some categories like Generation and Bids are hierarchically organised for drill down.
- Data can be viewed as chart or table and downloaded as CSV.
- Left and right buttons on the chart allow quickly switching to sibling reports.
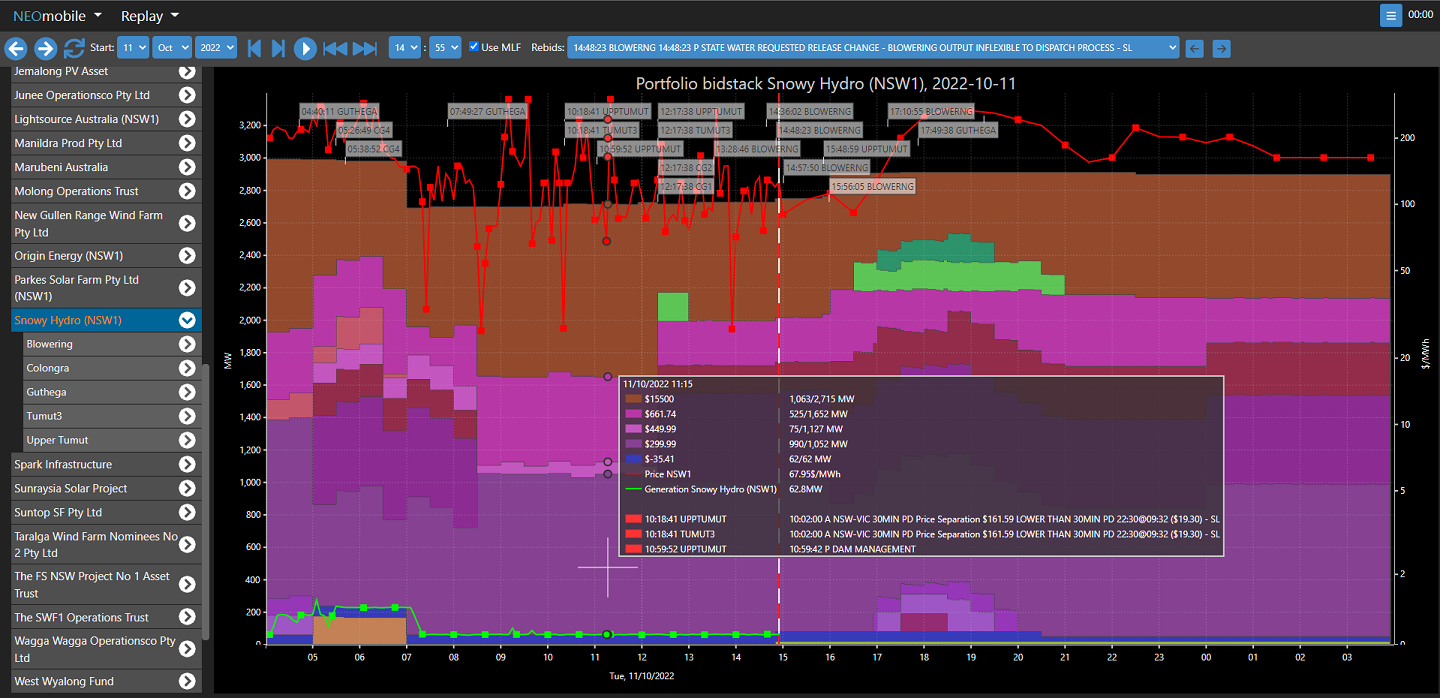
REBID ANALYSER
NEOmobile has a powerful feature we call Replay. Replay is a view for looking at a single trading day and replaying how the market changes at each 5min dispatch interval including RRP, generation , bidstack and rebidding with reasons.
View any single trading day since 1 April 2021. Animate or single step forward or backward through the day. Very fast because all prices, predispatch, and rebids are loaded for all scheduled generators for a single trading day so there is no round tripping to the server to select instances, animate or step. For more information see here.
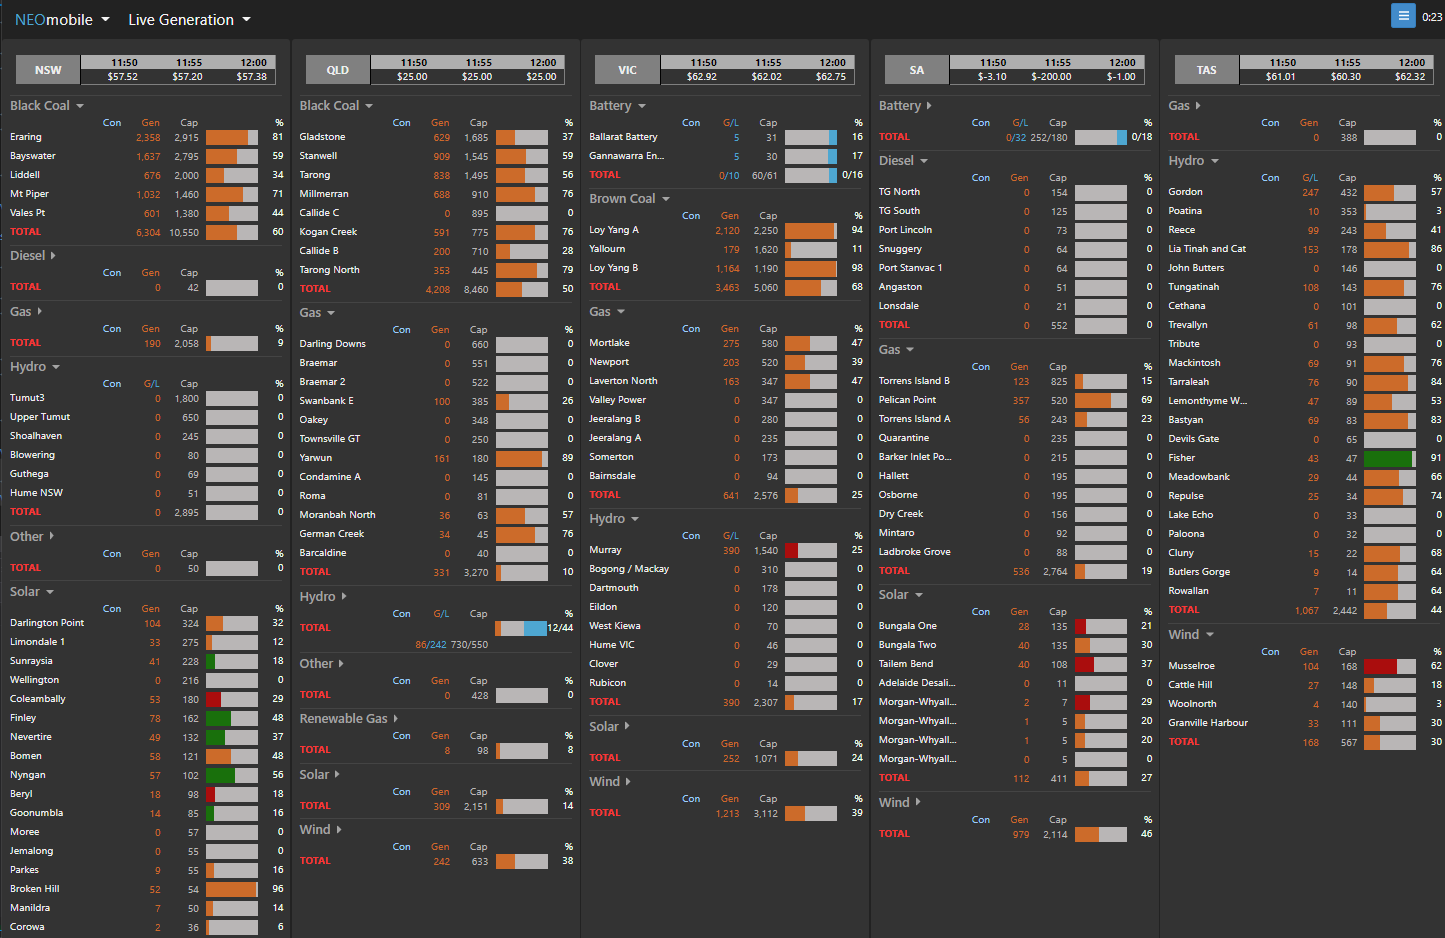
LIVE GENERATION
The Live Generation page shows the live generation for all the generators in the NEM. Where hydro generators are paired with a corresponding pump or load the load is also shown. Batteries also show both generation and load.
If actual 5min generation changes by more than 10% its shown as red if going down or green if up. Clicking on a station shows a popup chart of the generation for the day. If the station is currently constrained there is a link to the Constraint view so the user can view the plain language formulation of the constraint.
Generators are grouped by fuel type but can be optionally grouped by portfolio. Each group can be folded or unfolded.
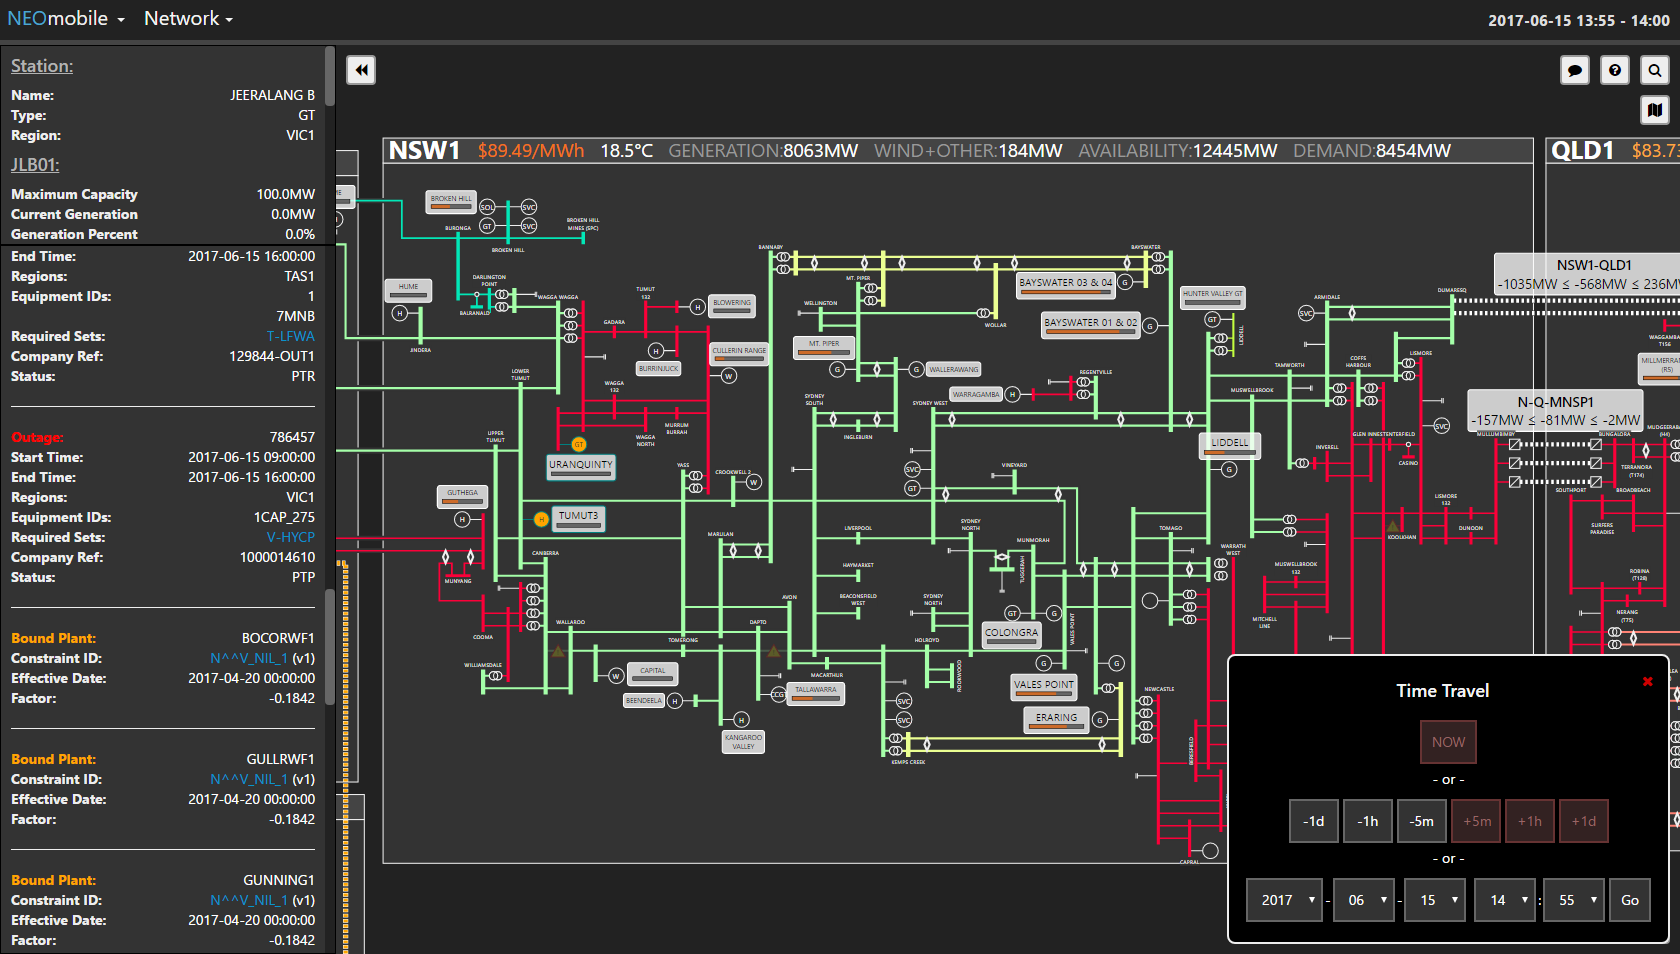
NETWORK VIEW
Network View is a powerful tool allowing you to visualise the status of the NEM in real time. Network view shows a comprehensive view of the high voltage distribution network, allowing you to pan, zoom, and query each element.
Scheduled outages, as well as generators and interconnectors bound by one or more constraints, are both listed and highlighted on the map. You can watch elements such as stations, links, buses, and interconnectors, and receive on-screen notifications in real time as their statuses change. For more information see here.
Bundle pricing
NEOmobile is available in a bundle with other services for a discounted price.
Annual subscription
Yearly subscription based service with no additional usage costs.
Friendly Support
Contact NEO support for any queries. We are actively developing this service and welcome all requests.
Easy to use
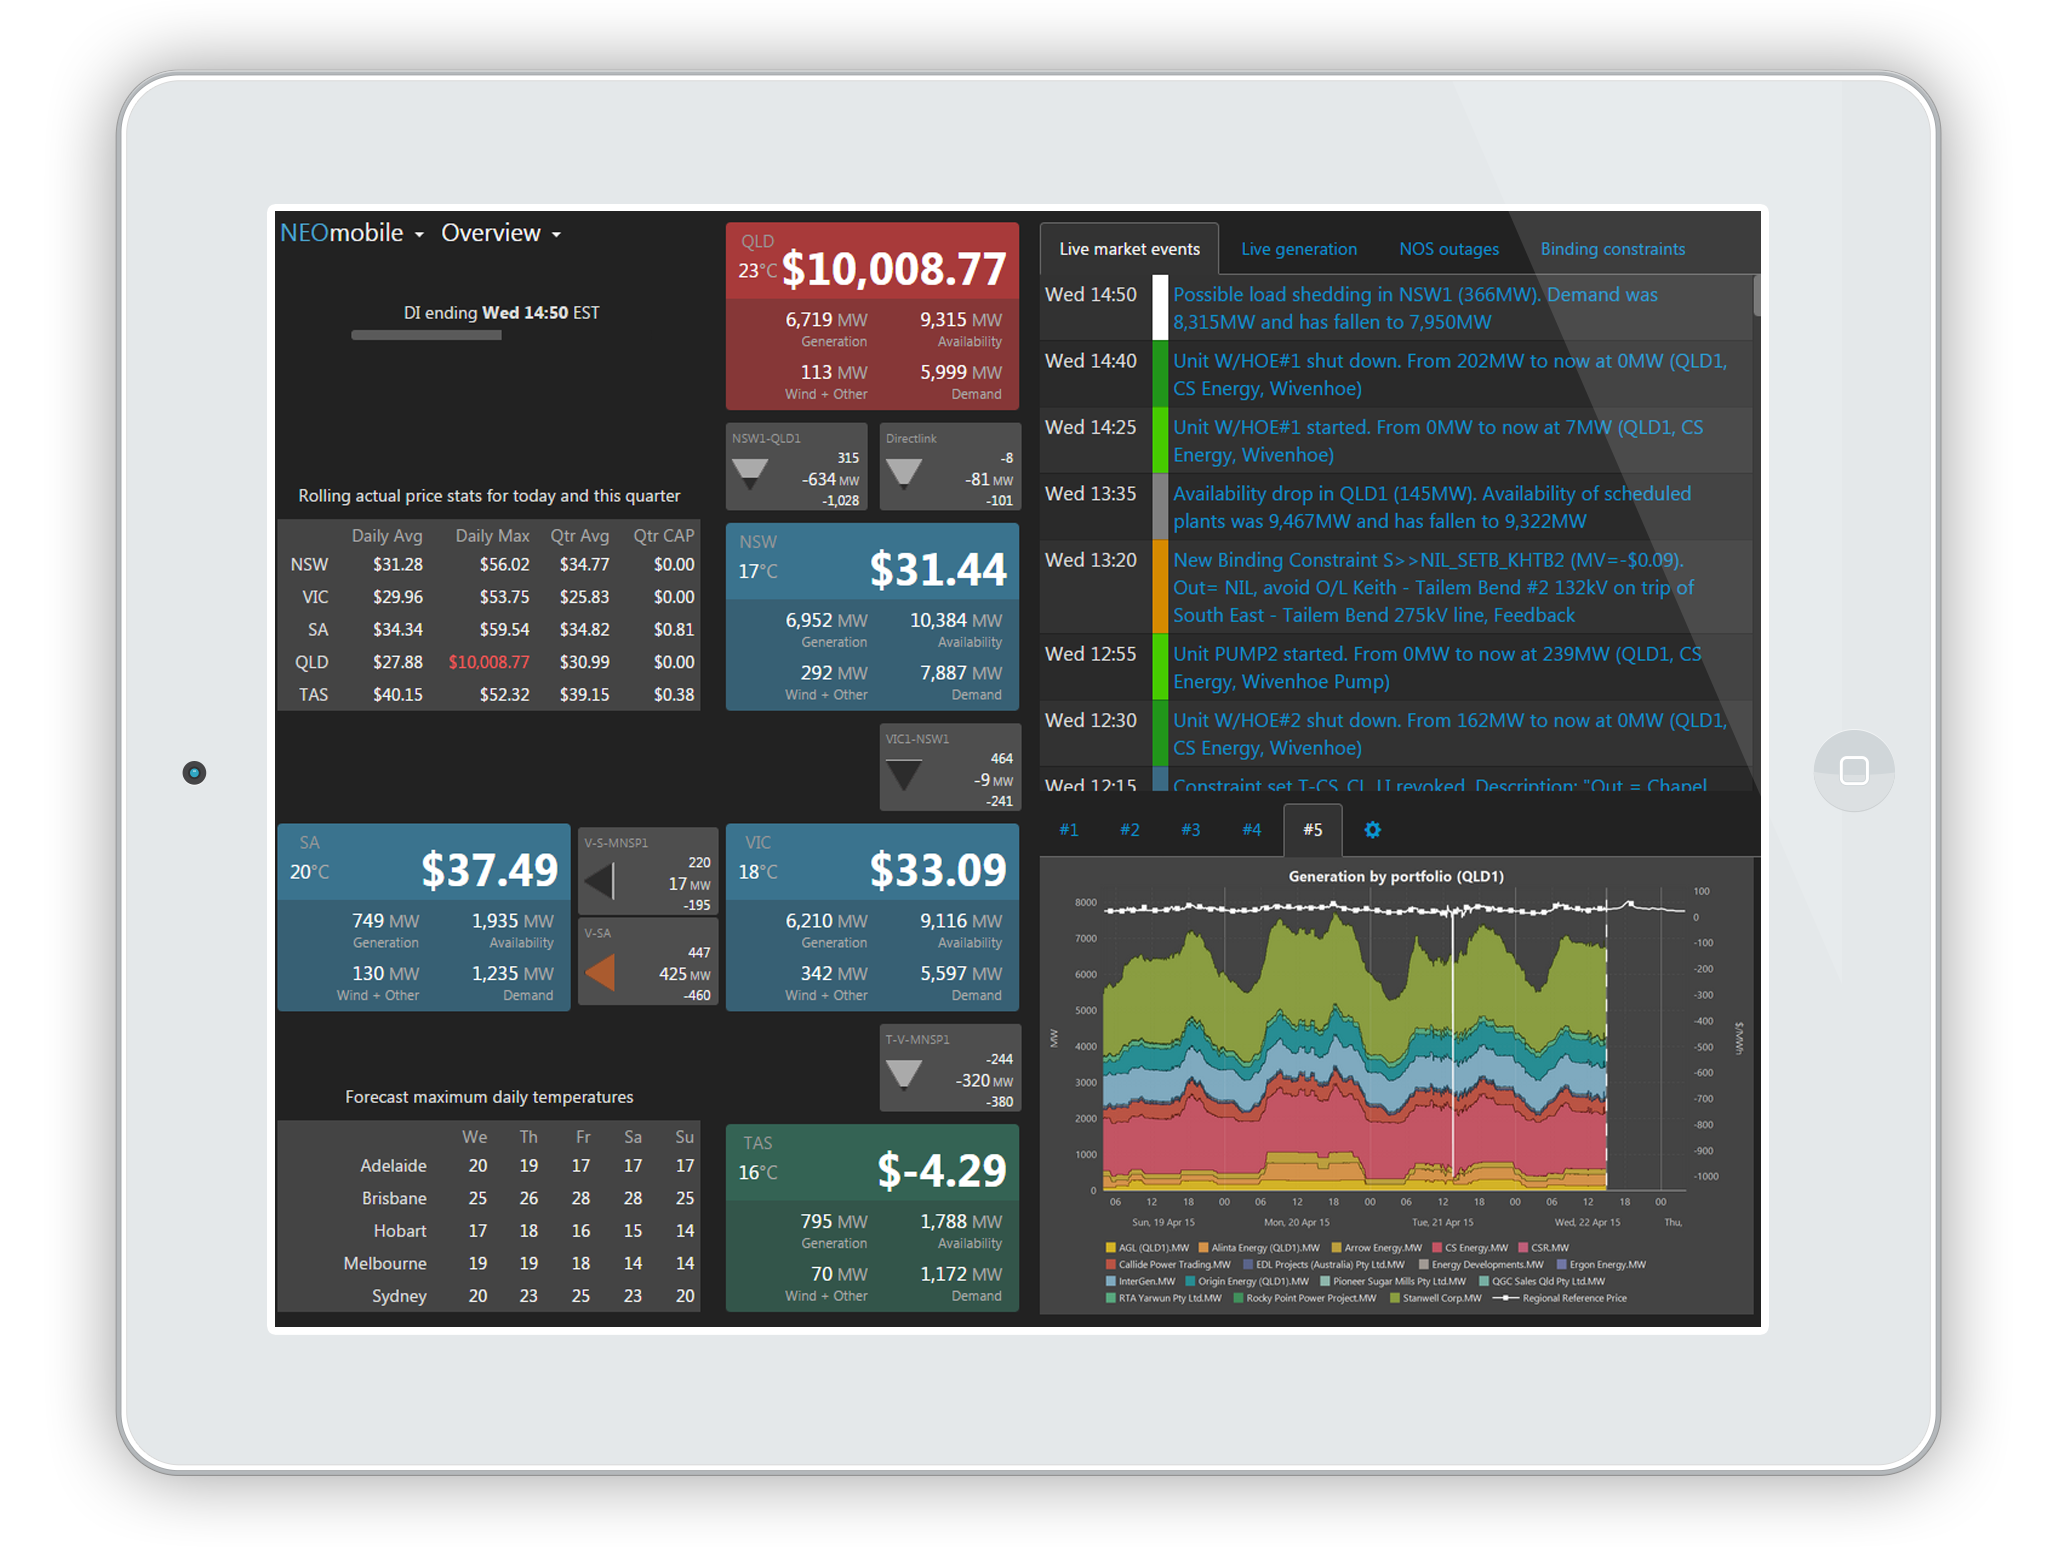
Whether for a quick overview or a lot of detail, the information you need, in the format you want, is easy to find. NEOmobile user-friendly overview page has a current snapshot in the form of a map, plus a list of market events.
Fast real-time updates
You'll be the first to know with NEOmobile. All data is real time and refreshed within seconds as soon as data is available, so you'll know immediately what's going on in energy markets, wherever you are.
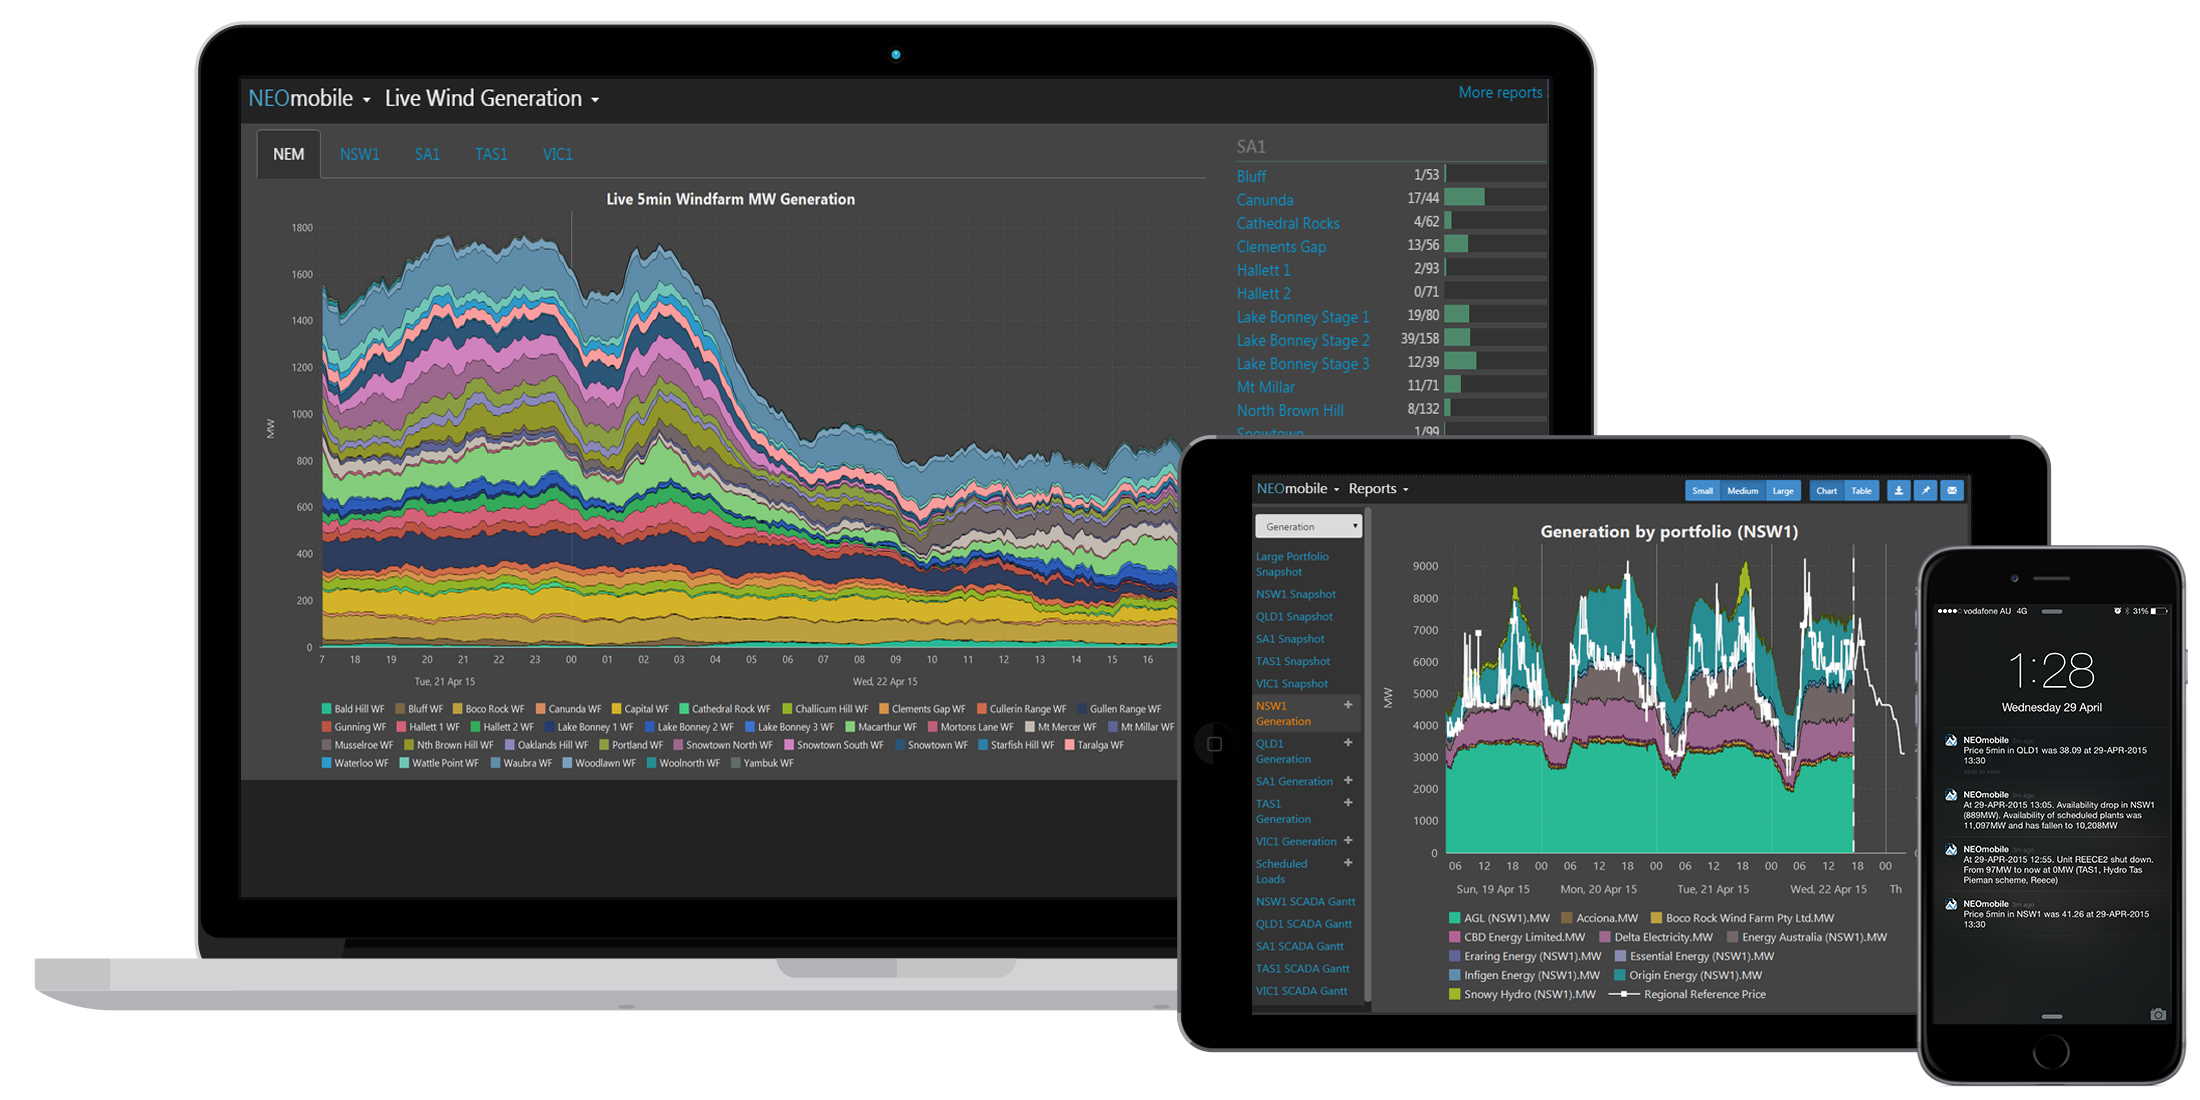
Designed for all devices
For iOS and Android mobile users, NEOmobile comes with accompanying app to allow you to view the information and receive the NEOmobile alerts anywhere you go.
Market event reporting
NEOmobile doesn't just report market activity, it helps you interpret it. With NEOmobile market reporting, each event type is colour-coded and linked to a report to get more detail. There is also a market event history page so you can see all events for a given date and it has a search feature that highlights all events containing a user defined search string.
Alerts to keep you up-to-date
For those who need to be ahead of the game, they can set NEOmobile to alert them when a particular event is occurring, either via Email or mobile app notification. The mobile app is available for iPhone and Android and provides very fast alert notifications - typically less than one second.
Comprehensive library of reports
NEOmobile has a comprehensive set of reports for you to quickly browse and access the market. Around 800 reports are provided and are organised heirarchically so you can for example quickly drill down on bid stacks from region to portfolio in the region, stations and plants.
Hosted in the cloud
NEOmobile is hosted in the cloud for high reliability to ensure maximum uptime. In addition we have a fully redundant backup site that also operates 24x7.
Search any constraint
NEOmobile also has efficient constraint searches with plain English descriptions. You can search for constraint sets or constraints. Selecting a constraint set will display all the constraints within it. When a constraint is selected all versions of that are listed by date and can be individually viewed.
Go beyond today
NEOmobile reports have the ability to go back in time to show not just current condition of the market, but historical as well.
Instant Access
Get connected and use on your choice of device.
IES provides powerful online tools for electricity and gas market data analysis, visualisation and simulation.
+61 2 9436 2555info@iesys.com
www.iesys.com
DATA ANALYSIS
Products / Services
MARKET MODELLING
Product and features
© 2026 Intelligent Energy Systems. All Rights Reserved. | Privacy Policy