A DATA VISUALISATION TOOL FOR ENERGY MARKETS
NEO is a data visualisation tool, designed to easily manage and display large and complex data from multiple data sources allowing meaningful insights to be made. NEO presents complex data sets in simple graphical formats. NEO is highly customizable, easy to create, share and run reports.
Big data
NEO has no effective limit on the number of data points that can be analysed. This allows the user to focus on data analysis rather than data handling issues. NEO also has an easy to comprehend object model with multi-threaded object importers to allow handling of huge numbers of instances, e.g. generic constraints.
Complexity of data
NEO presents complex data sets in simple graphical formats. NEO is also able to display data of different periodicity on the same graph - for instance, daily contract prices and 5 minute pool/spot prices. Aperiodic data can also be displayed. NEO can also display almost any combination of chart types and different scales in the one chart.
Visualisation
NEO provides pre-defined standard reports in graphical and tabular forms, distilling big data into easily understandable graphs. With NEO you can zoom into graphs and view sub-sets of data. NEO has advanced data tips, data links, charts types and a comprehensive interactive report styling capability for superb looking charts. Charts can also be styled dynamically based on the data.
Analysis
Split screens, cyclic means and freezing graphs while allowing other data to be plotted are some of the features available to assist in analysis. The scripting facility is supported by a library of mathematical and statistical functions for more advanced analysis. The extensive cascade styling provides another layer of analysis by modifying charts and tables based on data.
Energy market tailored
NEO also has in-built functions for processing many types of common market data such as bids, offers, supply curves, etc. NEO also handles advanced time period visualisation (e.g. peak, off-peak, shoulder, holiday) and statistical and other functions using the same time period definitions used in other parts of the business such as contracts.
Data services
NEO integrates well with your own favourite tools like Excel, Matlab, R, Python and SAS by allowing you to run NEO reports and get the data from those tools. The NEO application provides a web data service in all the most common formats, such as CSV, JSON and XML as required by these third party programs.
Alerts
NEO has an alerts functionality that configures on-screen and email alerts. Alerts are easy to create and highly user configurable. There is a complete history of alerts in this session with options to provide detailed logging for simplified fault finding.
Multiple data sources
NEO can link to data from multiple databases and display it in a single report. NEO supports Oracle, SQL Server, MySQL, SQLCE, PostgreSQL as well as non-database sources of data via our open source NEOdatasource package.
Security
NEO allows fine grained security with accounts and permissions down to the folder or object level. Global event logging is also an option that allows tracking of activity and identification of errors.
Customisation
NEO is highly customisable. It allows users to create or modify reports and variables. NEO has a 'Favourites" feature that allows grouping of shortcuts to reports.
QueryTool
QueryTool is available integrated with NEO to run queries for FREE. It is also available as a paid service where it hooks into our cloud database with the full history of MMS, STTM, DWGM and BOM data.
Word Reporting
This feature in NEO allows users to create one or more Word documents as templates with markup commands to e.g. run a report and insert the results as a chart or table or value into a generated Word document.
NEO Bids Accelerator (NBA)
NBA is available with NEO for faster bids reporting, specifically designed for Australian NEM MMS bids tables. The NBA is only available to NEO site licencees and is free of charge.
ABOUT NEO
NEO is a software package designed to easily manage and display large and complex data from multiple sources allowing meaningful insights to be made.
NEO for the Australian NEM consists of the NEO software, a comprehensive set of queries to a replication of the AEMO MMS, and many hundreds of pre-developed
analysis and graphical display routines.
For the Australian NEM, this enables phenomena such as the dynamics of generator bidding, competitive behaviour, price and physical market outcomes to be easily
understood and associated relationships explored.
Advanced users of NEO can add to and personalise the analysis capability of the package through the use of a scripting language that is available.
NEO is easy to learn and use. This means new users can be using NEO within an hour of starting.
Real Time Data
NEO's inbuilt Monitor function provides a fast lightweight facility for updating reports within seconds of relevant data being updated. This feature guarantees minimum loading on your network and database servers while at the same time delivering the fastest possible updates.
Batch Runs
Allows running of huge numbers of reports automatically at pre-programmed times. (e.g. Daily reports). Users can save results as either PNG, image files, CSV or NEO XML result files to file system or NEO workspace and these files can also be optionally emailed.
Sharing
NEO makes it easy to share report designs. The built-in fine grain security means you can protect individual reports or folders from modification and still make them available for sharing. NEO reporting is basically two layered with reports using variables. The variables are essentially SQL queries and the reports are just instructions on how to chart them or process them. This means that it is easy to create new reports by simply combining existing variables. NEO also provides what we call "favourites" which is a collection of shortcuts with headings, sub headings and items that may themselves be reports. They provide a convenient way of grouping reports for different types of users.
Time Classification
Allows flexible time period definitions, using the inbuilt timeslices or using simple queries returning time transitions. (e.g. Peak, Off Peak, Shoulders and Public holidays). This allows NEO to provide analysis functions like average off-peak prices that takes into account time period definitions and individual state holidays and it also means that these definitions will be the same as the "holiday tables" used by most contract trading systems. There is even a dedicated Time Classification view for detailed visualisation of these definitions.
Style Editor
NEO provides cascading styles for both charts and tables. The interactive styles editor displays all the styles at every level and allows modifying, disabling, deleting or adding styles and immediately seeing the results without re-running the report. Styles covers almost every visual aspect of charts like fonts, colours, widths, locations, formats and layouts.
Non Database Data
We provide free open source software for users so they can develop their own data sources and thus allow access to non-database sources of data. (e.g. CSV files, RESTful data services, SCADA, etc.) This data can then be made available via NEOpoint and NEOdashboard.
Support
IES provides and makes available a complete and tested library of reports to our customers. We also provide free assistance in understanding the market or creating reports on request (subject to reasonable limitations).
Full suite
NEO is a desktop application but is just part of a large suite of products and services. One of the elements of the suite is NEOpoint which is basically a web based version of NEO allowing easy access with just a browser.
NEO in action
NEO has many views which assists in analysing and displaying data. It has been specifically designed as a generic tool and has many built in extensions for energy specific analysis. Some of the other design goals have been to make it highly user configurable and to make it easy for users to share reports. The unique two layer design of NEO wherein NEO reports use "variables" means that it is easy to mix and match and reuse reports.
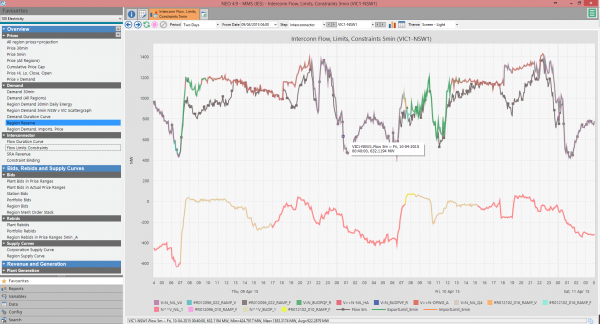
In this view we can see Favourites used on the left of the screen. These provide a bundled list of short cuts to reports with the option to set parameters or even time periods. The right side of the screen shows a chart that highlights NEO's ability to modify line colours or line highlighting based on other data sets.
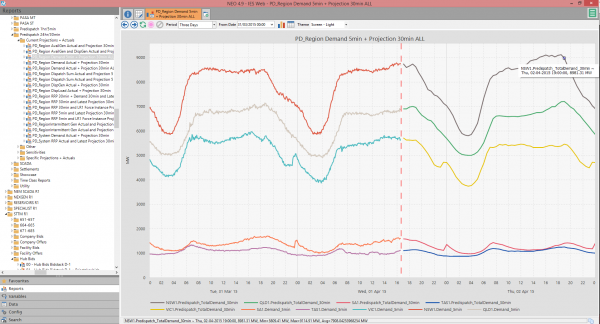
In this view the left hand side of the screen shows a tree view of reports. NEO uses "lazy loading" to be able to easily and quickly handle millions of reports. The right side of the screen shows a "candy cane" marking the current active time period with forecast values to the right and actual values to the left as obtained from live market data.
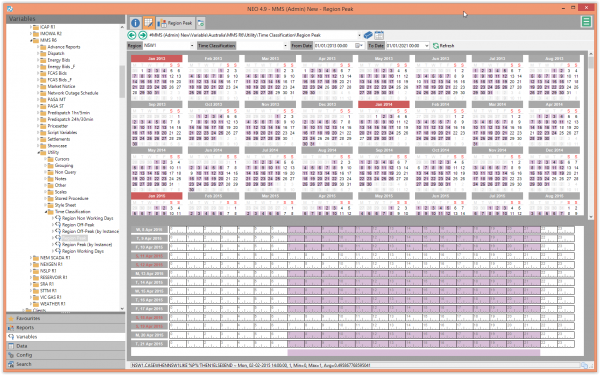
This is the Time classification view which shows the month and down to the minute level when defined time periods such as peak, off-peak or any user defined period is true. NEO can use time periods for analysis that are linked to definitions used by other systems such as contract systems thus giving analysts a consistent view of their data across systems and across regions.
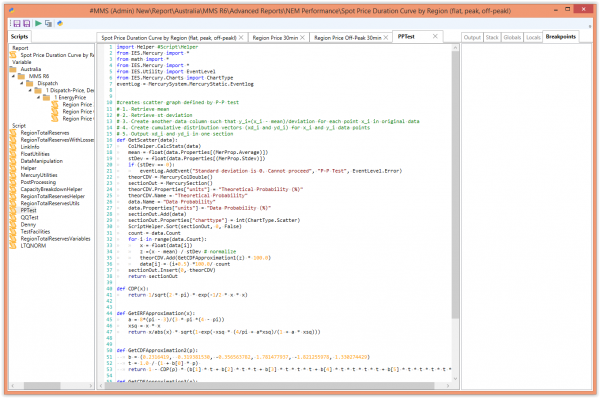
The above is the scripting view. This is a complete IDE for developing Python scripting to process data. It offers the usual editing features along with breakpoints and variable inspection.
IES provides powerful online tools for electricity and gas market data analysis, visualisation and simulation.
+61 2 9436 2555ies@iesys.com
www.iesys.com
DATA ANALYSIS
Products / Services
MARKET MODELLING
Product and features
© 2024 Intelligent Energy Systems. All Rights Reserved. | Privacy Policy